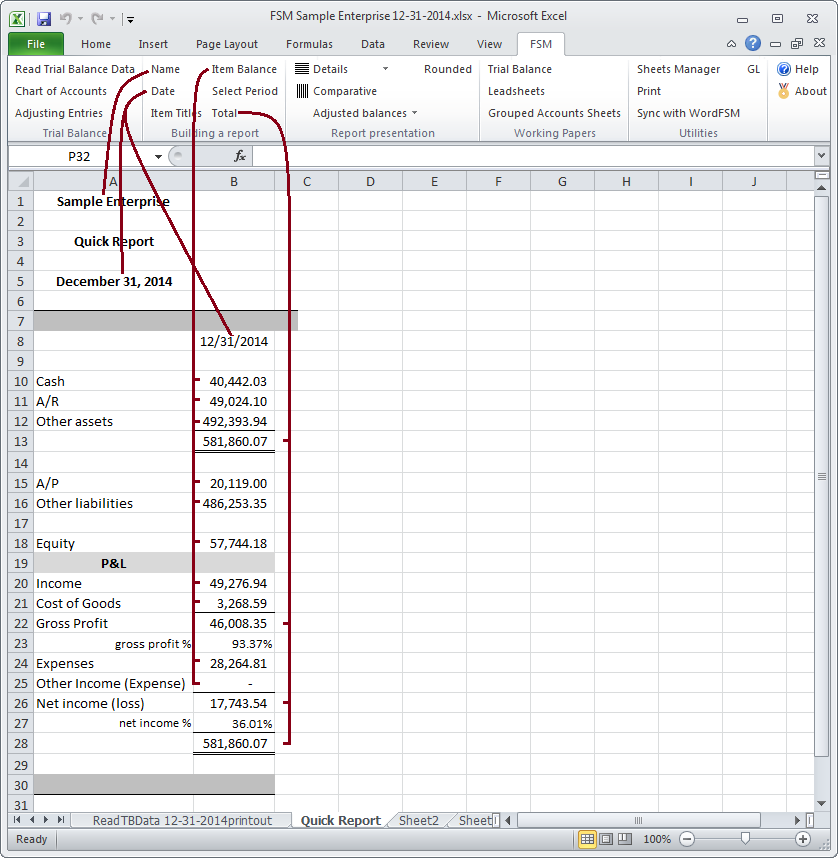
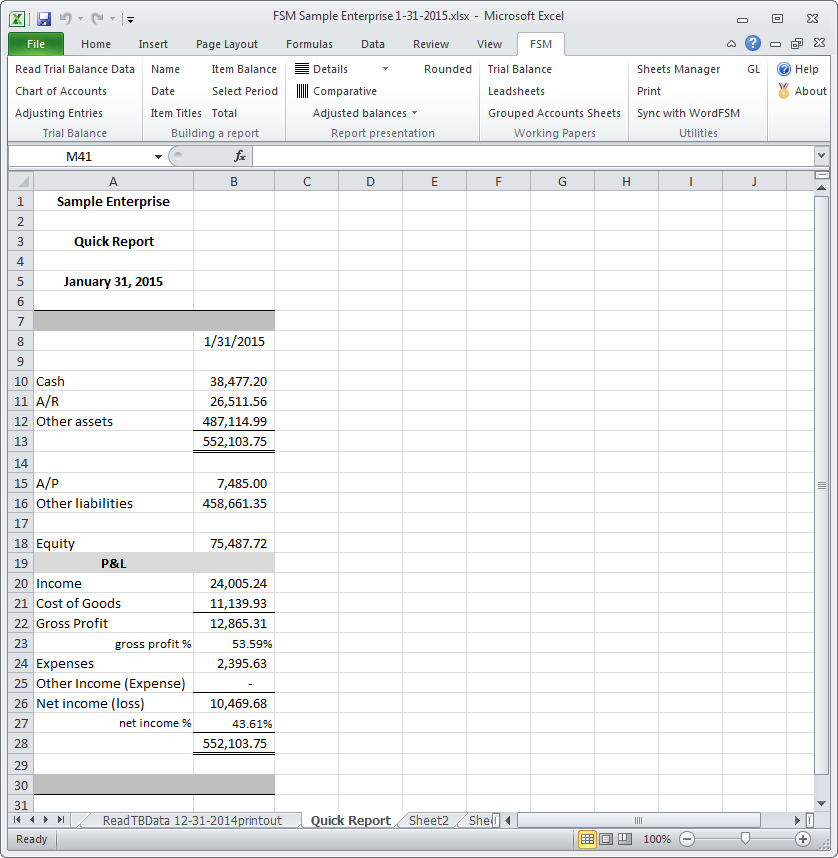
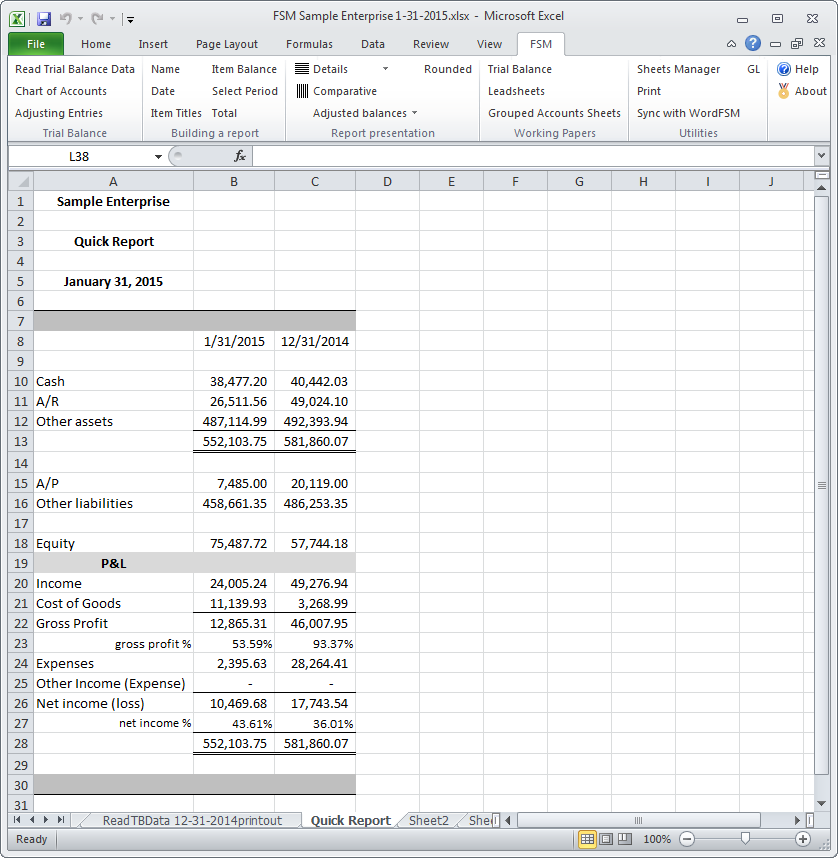
Quick Report with Financial Key Figures
‘Year To Date’ Balances AND ‘Periods Range’ Balances
(on the same column)

How to prepare a Quick Report showing Financial Key Figures, as the sample above.
In a blank workbook, click ‘Read Trial Balance Data’ and specify the oldest trial balance as-of date you want to include in the report.
Once the data has been imported, use the following FSM ribbon buttons to initialize the cells .
Notes
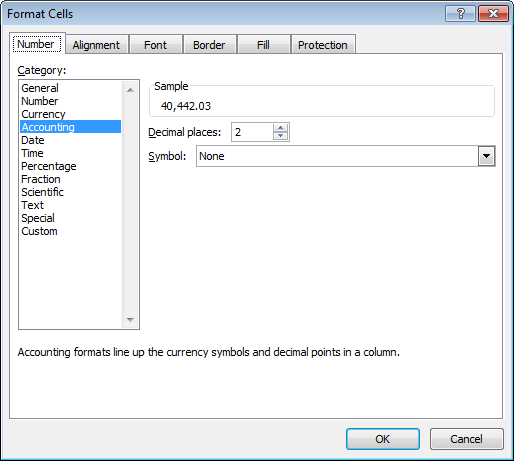
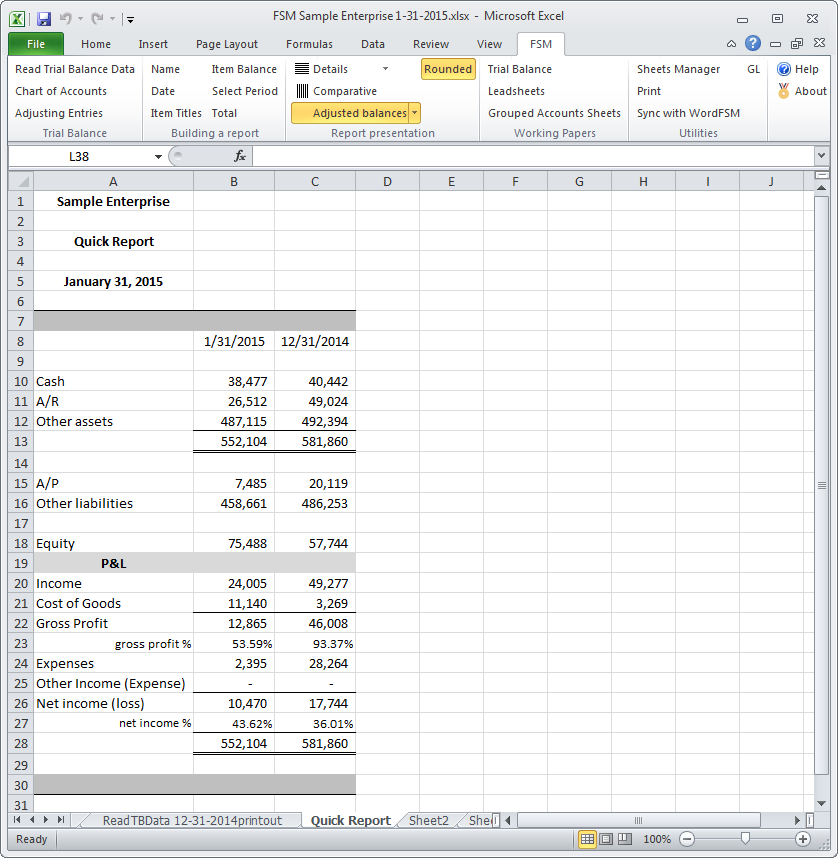
Format selected for the balances in the sample is
The sense of an Item allows ExcelFSM to know whether or not the computed balance must be shown between parentheses. If the computed balance of an Item has a the same sense than the sense of the Item, the balance is shown without parentheses
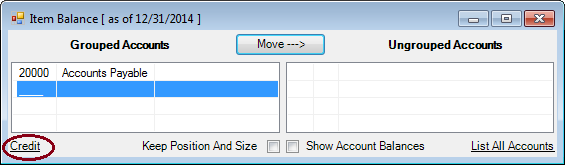
Simply click it to change the sense of the Item.
(This does not change the computation of a balance. This is only for presentation purposes.)
To present rounded balances, simply click the FSM button ‘Rounded’

If the rounding process results in an out of balance of 1 between the Total Assets and the Total Liabilities & Equity, simply record an adjusting entry to rectify the situation.
In the sample above, looking at the read trial balance
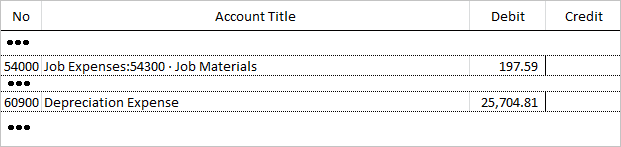
the following entry was recorded
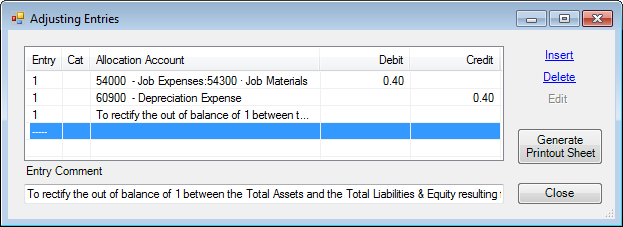
where debiting 197.59 with 0.40 will not change the ‘rounded’ balance of 198, but where crediting 25,704.81 with 0.40 will change the ‘rounded’ balance from 25,705 to 25,704, eliminating the out of balance of 1, without changing the results.
‘Read Trial Balance Data’ of the succeeding period.
A new workbook has been created, in which the report is automatically updated.
This new workbook contains the two trial balances read so far.
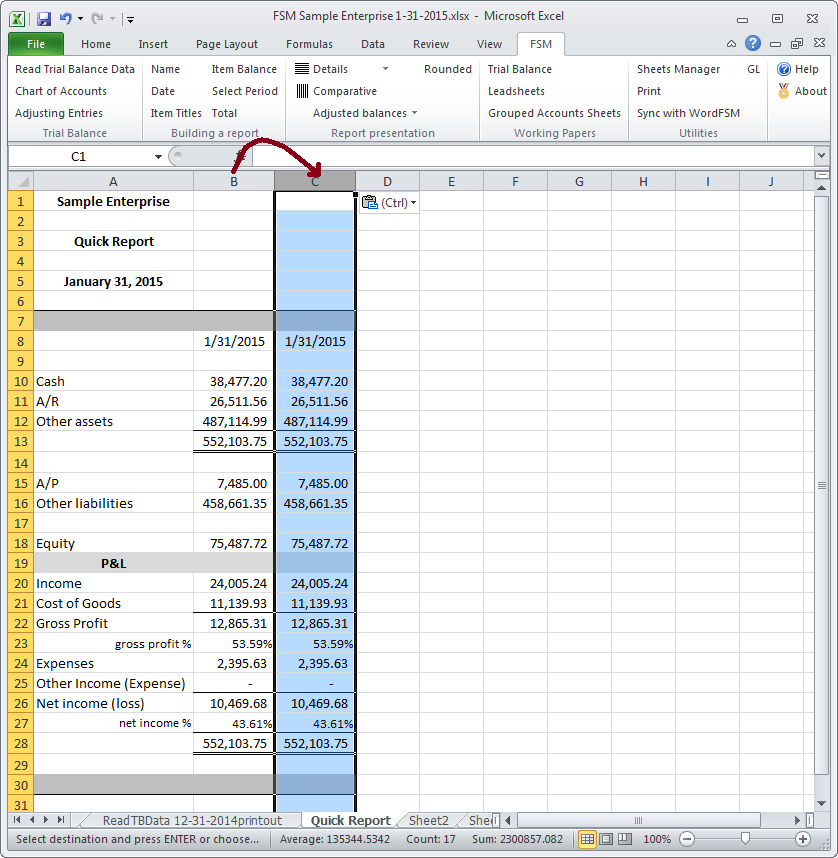
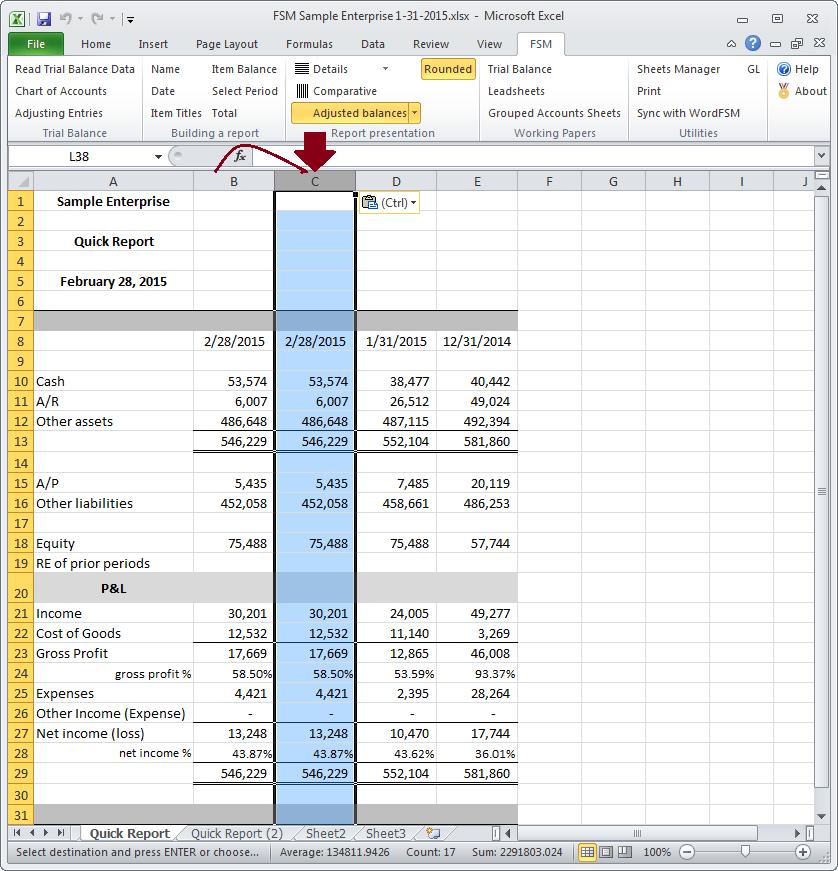
Copy the current column
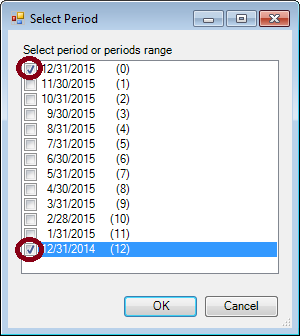
Click the Select Period button
Check the period and click OK.

The Quick Report now shows the balances of the two trial balances read so far.
Click the FSM ribbon button ‘Rounded’ to present rounded balances
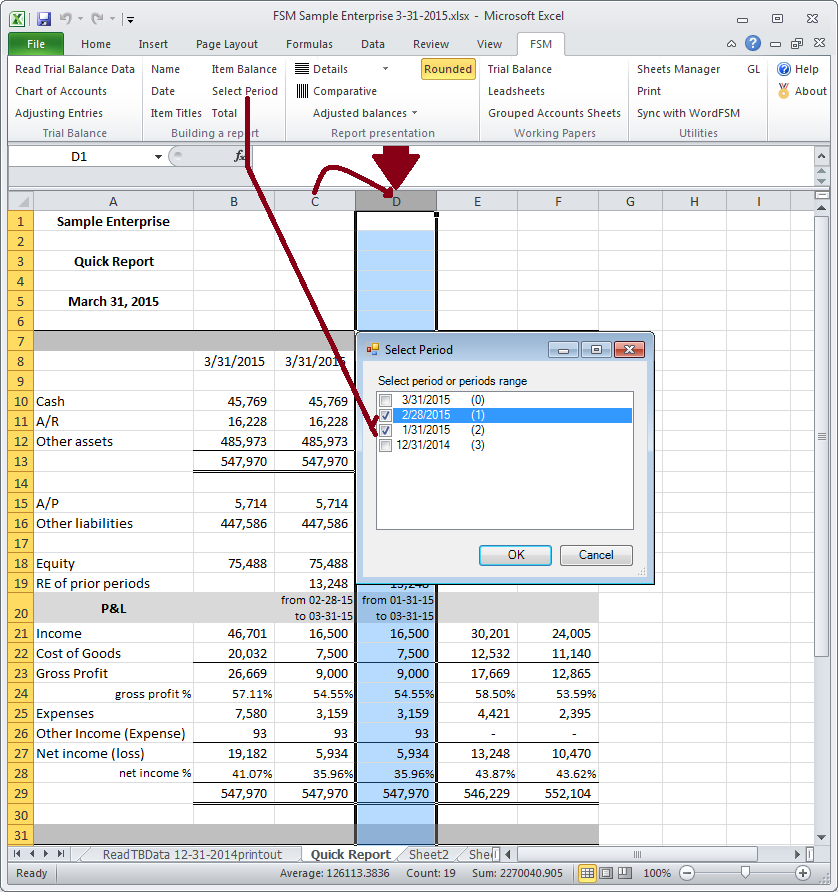
‘Read Trial Balance Data’ of the succeeding period.

A new workbook has been created, in which the report is automatically updated.
This new workbook contains the three trial balances read so far.
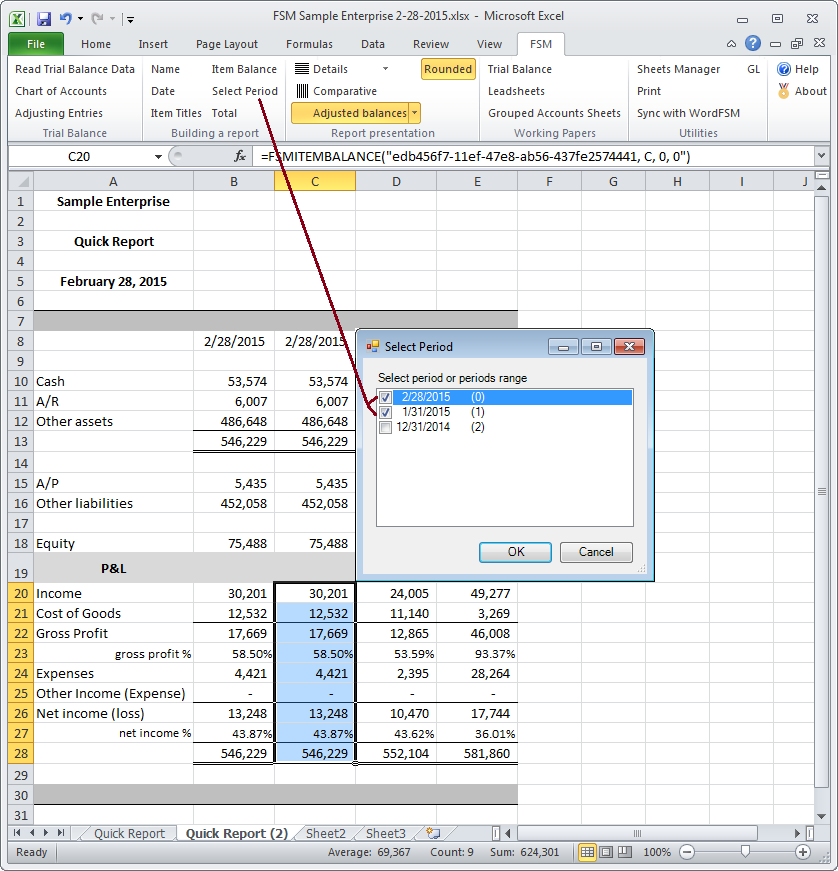
Copy one of the columns
Click the Select Period button
Check the period and click OK.
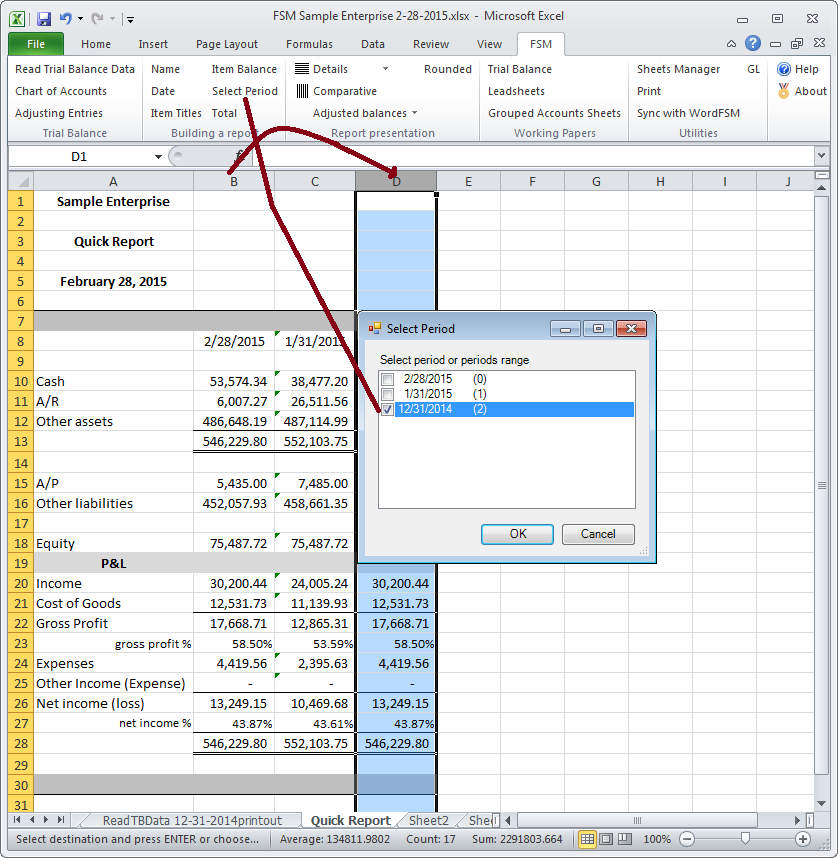
The Quick Report now shows the balances of the three trial balances read so far
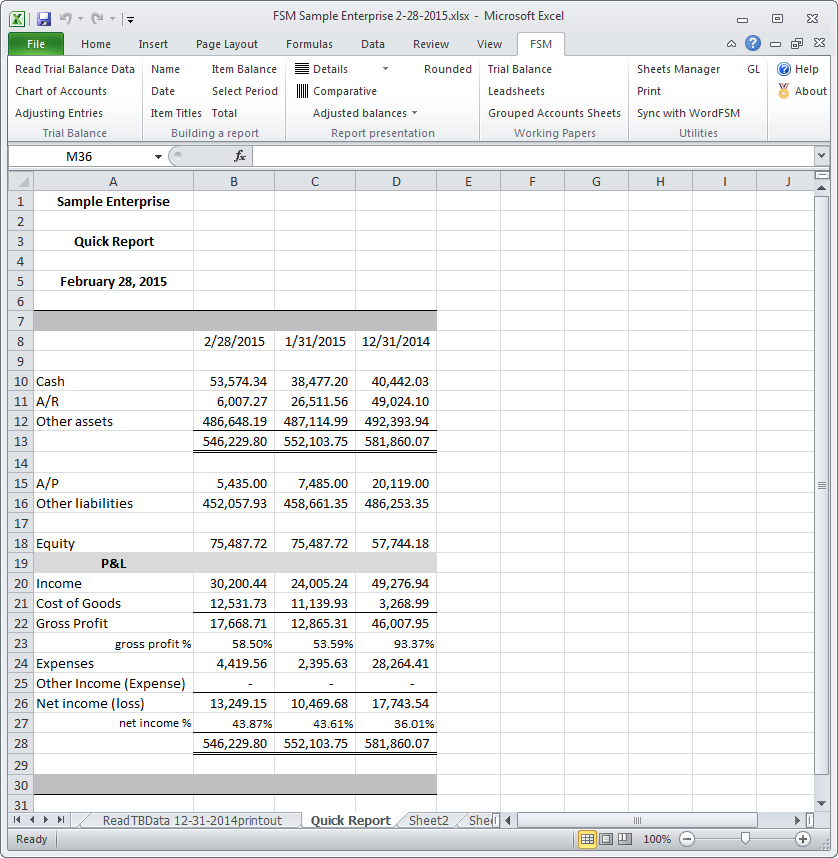
which are:
- the end of prior year (12/31/2014)
- the first period of current year (1/31/2015)
- the second period of the current year (2/28/2015)
The trial balances read are cumulative. Consequently, the balances shown for the second period are the year to date balances as of 2/28/2015.
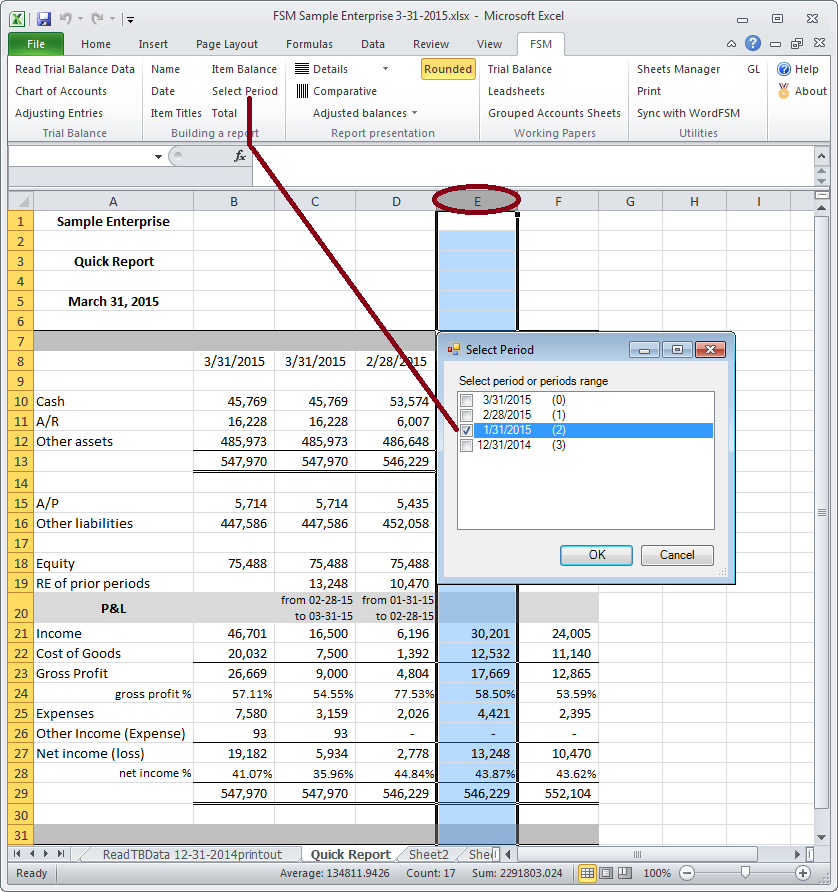
How to show the Profit and Loss of one period
Insert a column
Copy the current column
Select the range of cells of the P&L
Click the Select Period button
Check the periods range and click OK.
Since the report combines cumulative balances and periodic balances, here is a suggestion to indicate it:
- Use the ‘TEXT’ function, which converts a value to text in a specific number format, to indicate the periods range.
- Press CTRL+ENTER before “ to…”, to get it on a second line
- Click the ‘Wrap Text’ button
- Click the ‘Align Text Right’ button
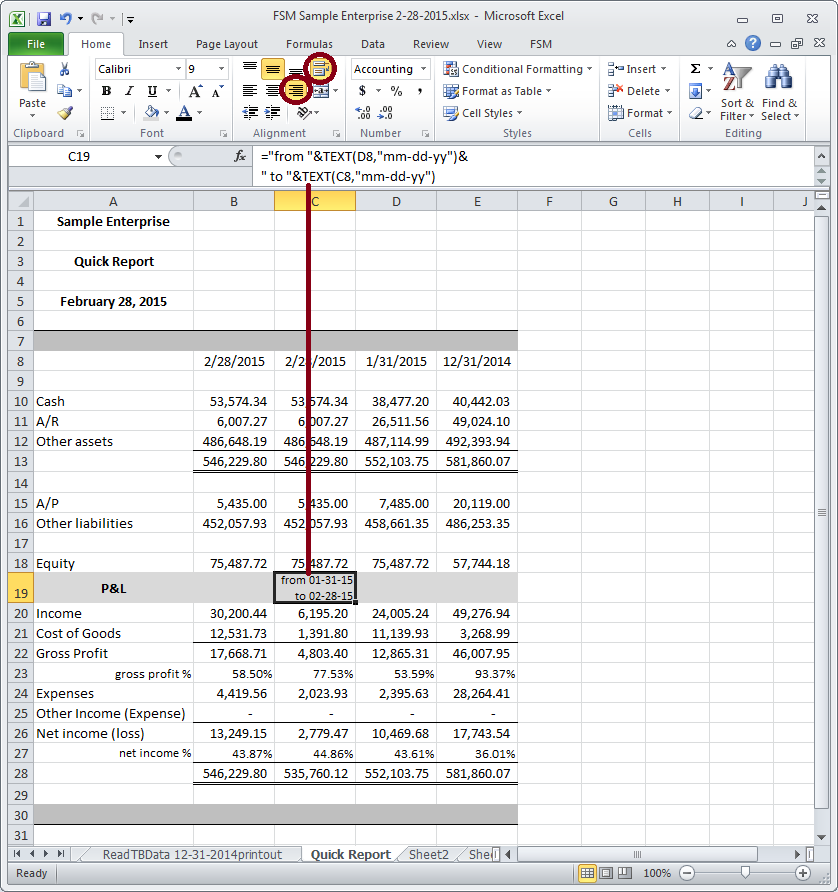
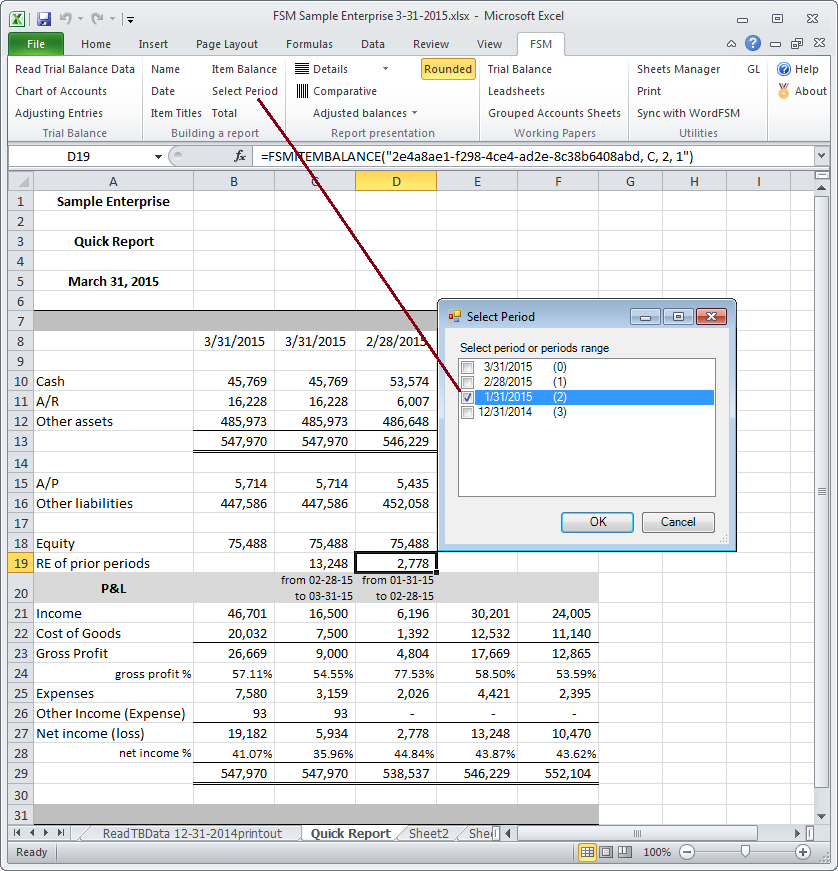
Cumulative Retained Earnings of prior periods
As we can see, the ‘Total’ of Liabilities, Equity and P&L (535,760) differs from the ‘Total’ of Assets (546,229). The ‘Retained Earnings’ of prior periods is missing.
Insert a row for the item ‘Retained Earnings of prior periods’
Click cell C19
Click on the Item Balance button
Click on 'List All Accounts' at the bottom right, to temporarily list all the accounts in the Ungrouped Accounts right list
Group the P&L accounts.
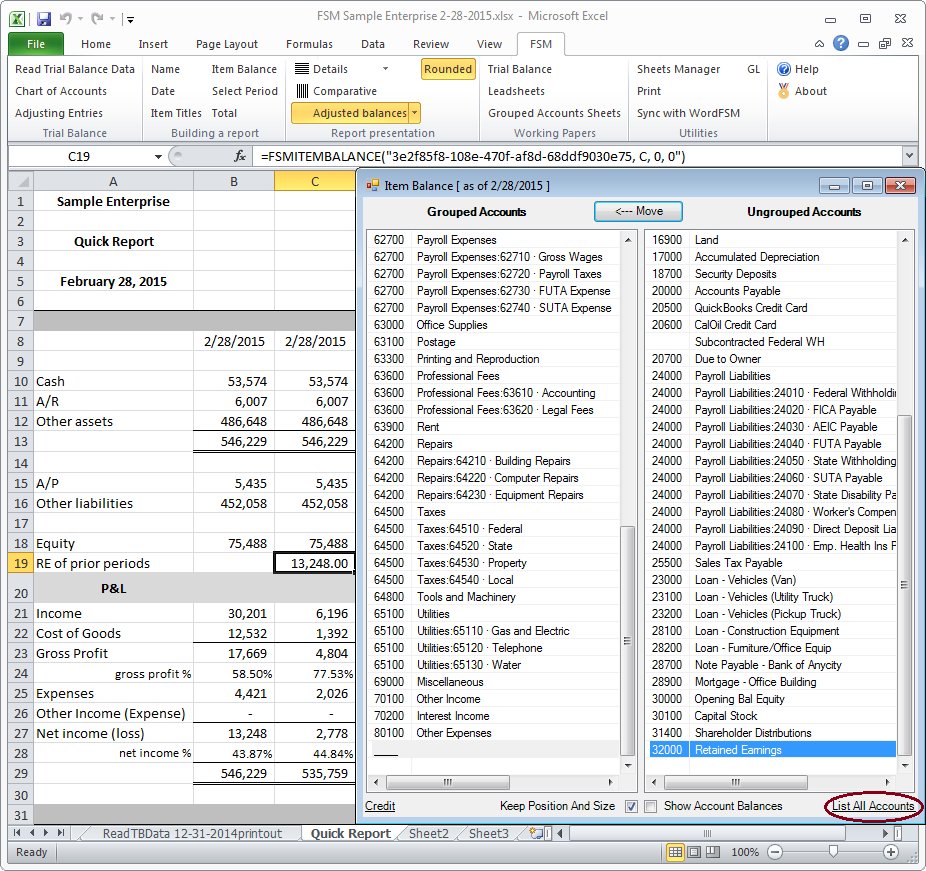
Click the Select Period button
Check the period or periods range and click OK.

Click the FSM ribbon button ‘Rounded’ to present rounded balances
Double click the ‘Total’ cell and group the new item.

Reading the trial balance of the succeeding period, a new workbook is created, in which the report is automatically updated.
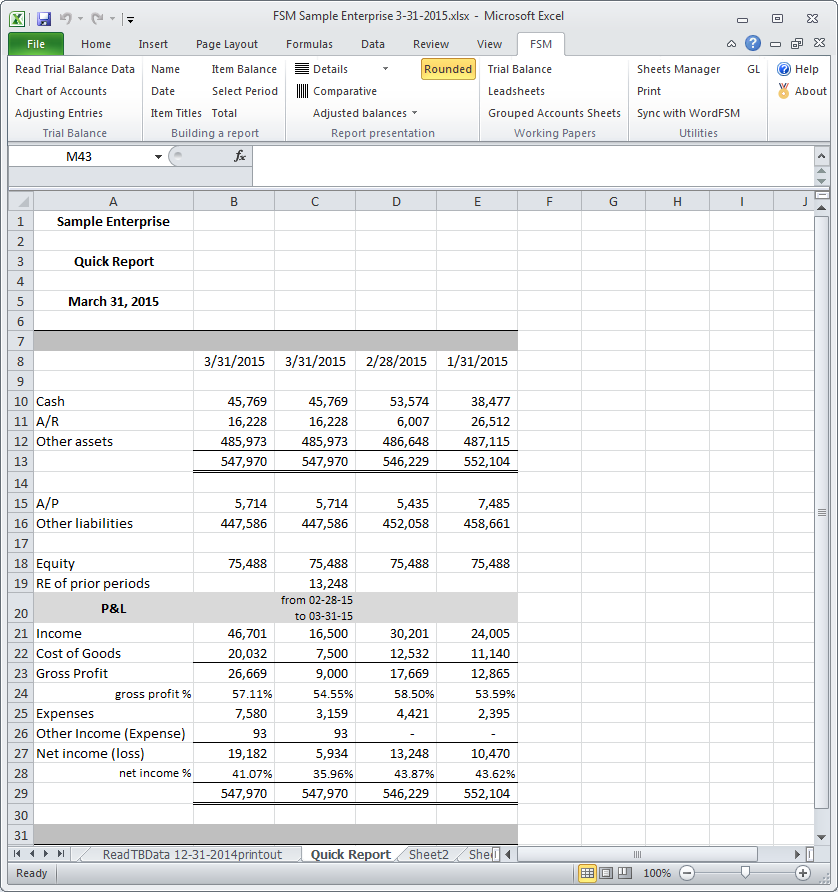
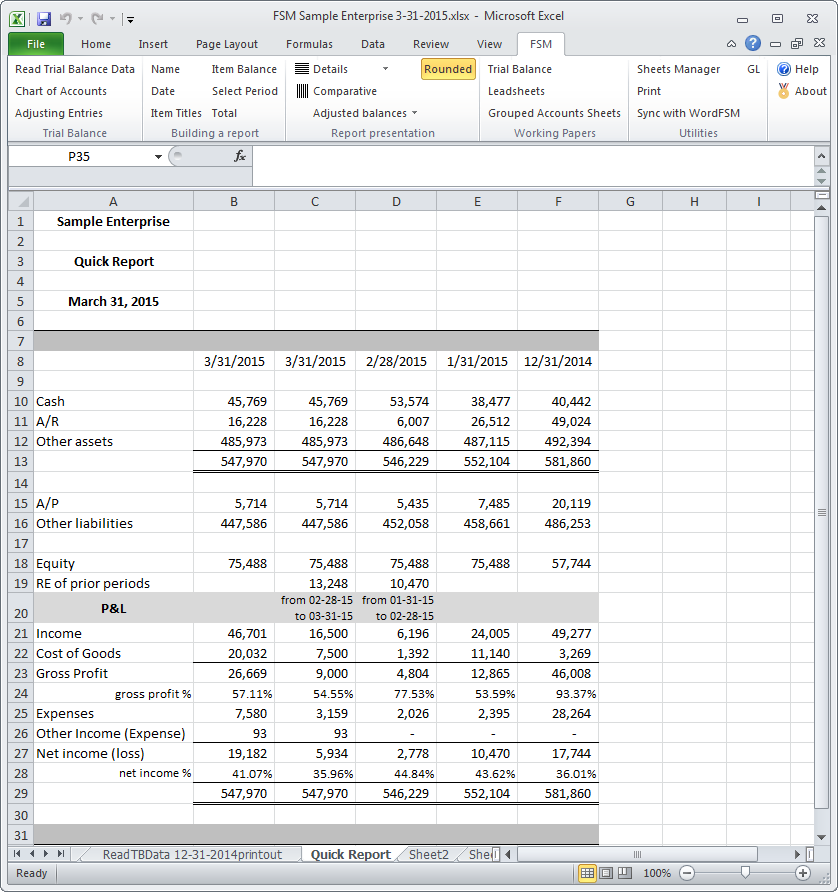
Column B shows the year to date balances, as of March 31, 2015 (the third period of the current year)
Column C shows the P&L for that third period
Column D shows the cumulative balances for the second period of the year (Here we want the P&L for that period, not the cumulative P&L)
Column E shows the cumulative balances for the first period of the year
Balances of the end of the prior year are no longer there.
Adding the new column following the Read Trial Balance Data of the succeeding period
Insert a column for the P&L of the second period of the year
Copy the column of the P&L of the third period of the year
Click the Select Period button
Check the appropriate checkboxes for the periods range
Select the range of cells of the Balance Sheet section
Click the Select Period button
Check the period and click OK.

Click on the 'RE of prior periods' item balance cell
Click the Select Period button
Check the period and click OK.
(Could avoid having to copy the cell by not including it in the range of cells in the previous step where copy the range of cells of Balance Sheet containing the cumulative items balances for the second period of the year)
Set the periods for the last two columns to show the cumulative balances for the first period of the year, and the balances of the end of the prior year:
Select column (click the letter of the column)
Click the Select Period button
Check the period and click OK.
Repeat those steps for the prior year column.
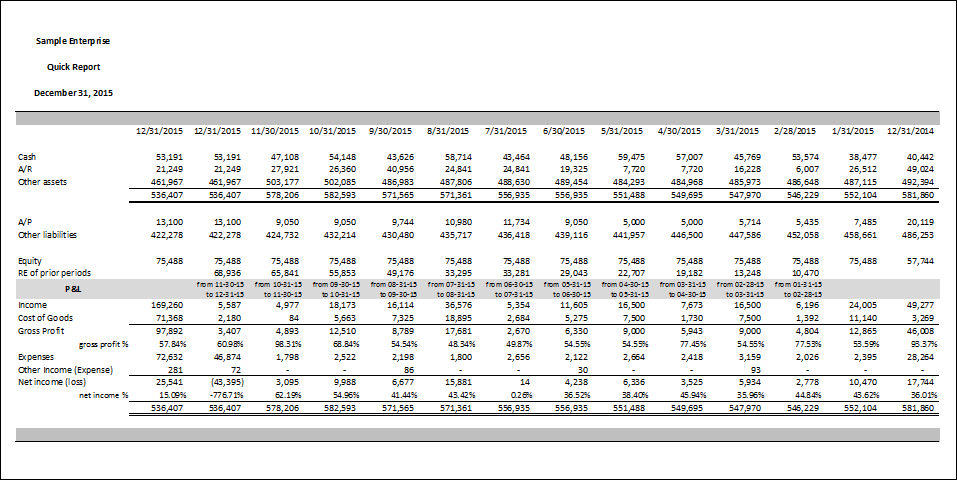
Here is the report
with columns showing cumulative balances with period indexes being the same for all items in a column (columns B,E,F),
and columns showings balance variations (P&L items) and cumulative balances, with different period indexes (Balance sheet items and RE of prior periods), in the same column (columns C,D).
Going forward with the ‘Read Trial Balance Data’ of succeeding periods, you will simply add a new column as described above, for each period,
and ‘Select periods’ to reset the first period of current year column (1/31/2015) and the end of prior year column(12/31/2014).
Notes
You can keep the end of prior year column(12/31/2014) unchanged from one period to another, by doing Copy&Paste (Paste Values) for the entire column. The drawback is that FSM ‘Details’ button will not work for this column, but you can always get it back to its original, with the FSM formulas, by copying one of the column showing cumulative balances and then doing ‘Select Period(s)’ to set it to the end of prior year as of date.
This can be used for a budget column as well, which budget column was imported as described here Importing Budget Trial Balance data.
To present a column showing the variation between the year to date and the end of prior year (or budget), copy a column and select the proper periods range with the Select Period button.